Example 2: Sharp corner on L Bracket
Location of Singularity
|
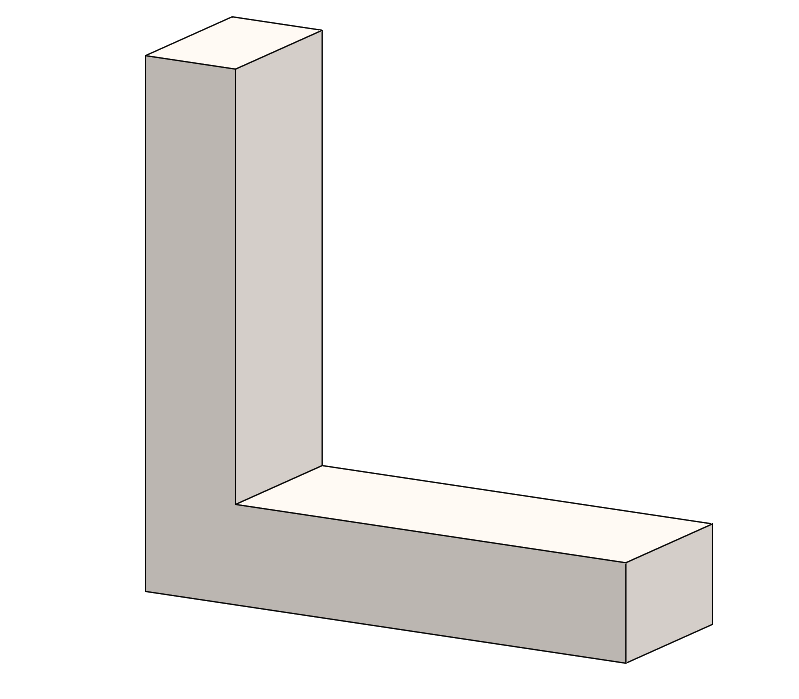
For this example, I am going to use a model almost all SOLIDWORKS simulation users are familiar with but with a few modifications. As you can see in Figure 14, the L bracket has a sharp corner where it changes direction. This sharp corner is a definition singularity and a perfect second example to confirm my results.
Sensor Grid and Sensor Locations
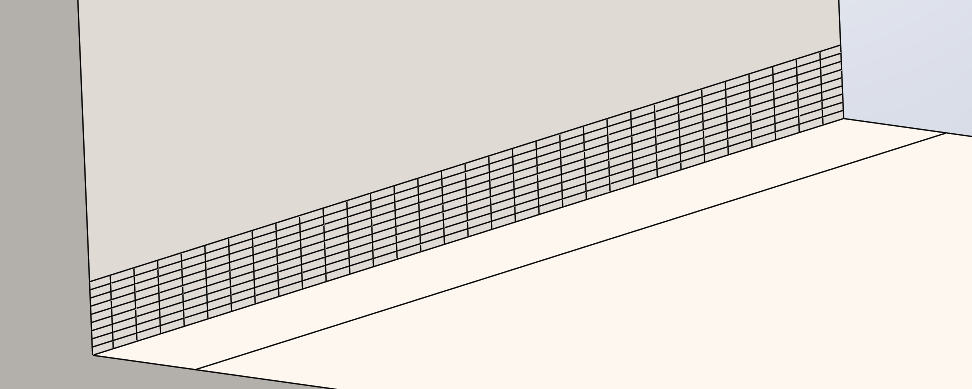
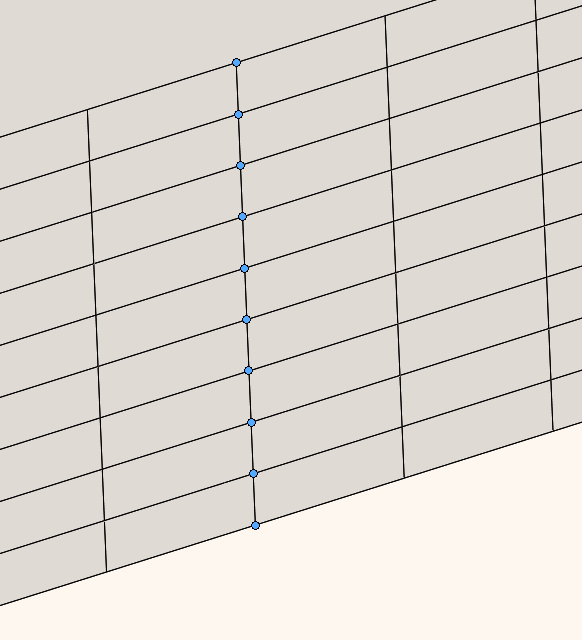
Using the same method as described in the previous example I created a grid of faces where I could place sensors. I put 10 sensors starting at the location of the singularity and placed another sensor at every intersection moving away from the corner as shown in Figure 16. For sizing reference the first and last sensors are 2 mm (0.078 in) apart. As you can see in Figure 15 the grid was placed along the entire length of the face and this was done to get a better resolution of the mesh around the sensors and have the ability to incrementally increase the mesh away from the sensors.
|
|
|
|
Results
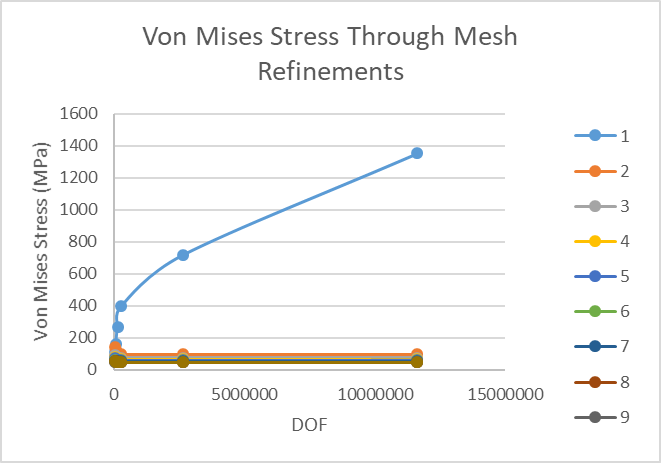
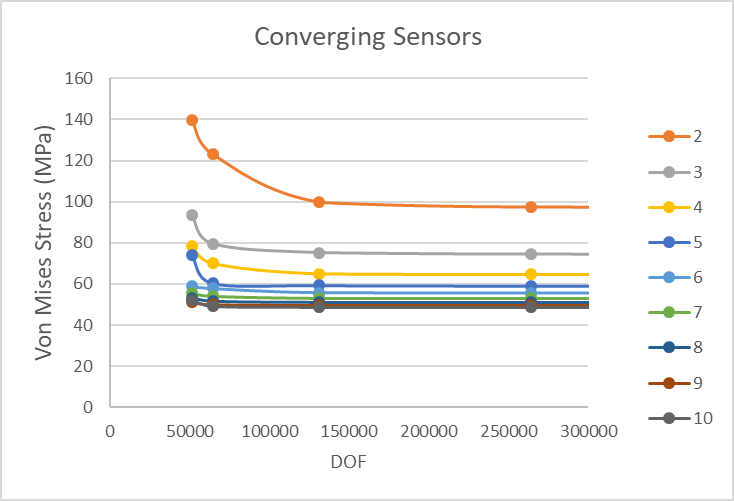
I was able to get all of the sensors that were not on the singularity location to converge after refining the mesh in the area as shown in Figure 17. Figure 18 is proof of all sensors convergence in a plot where the resolution is not skewed by the singularity. All of the data can be seen on Table 9 and if you look closely you can notice the eleven million degrees of freedom in run 6 which is ridiculous but I wanted one more data point and to see how far I could push the problem.
|
|
|
|
| Von Mises Stress (MPa) | ||||||
| Sensor | Run 1 | Run 2 | Run 3 | Run 4 | Run 5 | Run 6 |
| 1 | 110.382 | 158.072 | 265.174 | 397.257 | 718.952 | 1354.51 |
| 2 | 139.774 | 123.274 | 99.908 | 97.4845 | 96.3525 | 96.6774 |
| 3 | 93.6944 | 79.6257 | 75.2115 | 74.3946 | 74.1601 | 74.3239 |
| 4 | 78.3395 | 70.1509 | 64.9787 | 64.6465 | 64.625 | 64.7646 |
| 5 | 74.1552 | 60.4152 | 59.3119 | 59.1251 | 59.1377 | 59.2961 |
| 6 | 58.8188 | 57.7936 | 55.634 | 55.5161 | 55.5623 | 55.1641 |
| 7 | 55.4864 | 54.1118 | 53.0916 | 52.979 | 53.0301 | 53.1641 |
| 8 | 53.2633 | 51.7181 | 51.2172 | 51.1173 | 51.176 | 51.3084 |
| 9 | 51.0229 | 50.0535 | 49.7581 | 49.7052 | 49.7728 | 49.8906 |
| 10 | 52.235 | 49.1785 | 48.6557 | 48.572 | 48.6421 | 48.7568 |
| DOF | 51594 | 64482 | 131232 | 264159 | 2634474 | 11645379 |
Conclusion
Since all the sensors converged after the third run I can comfortable say that the results are independent of the mesh and I can get that independence as close to the singularity as I desire as long as I get my mesh small enough. For this example the distance of the sensors from the singularity can be seen in Table 9 and the closest sensor converged and was 0.22 mm or 0.0087 in from the singularity. This is really close and the values seem believable especially after they are compared to the same model but with a fillet instead of a sharp corner. The maximum stress I obtained with the filleted model was 102 MPa and the sensor that was .022 mm from the singularity read 96 MPa. Fairly accurate if you ask me.
| Sensor | Distance From Singularity (mm) | Distance From Singularity (in) |
| 2 | 0.222221 | 0.008749 |
| 3 | 0.444443 | 0.017498 |
| 4 | 0.666666 | 0.026247 |
| 5 | 0.888887 | 0.034996 |
| 6 | 1.111111 | 0.043745 |
| 7 | 1.333332 | 0.052493 |
| 8 | 1.555553 | 0.061242 |
| 9 | 1.777777 | 0.069991 |
| 10 | 2 | 0.07874 |
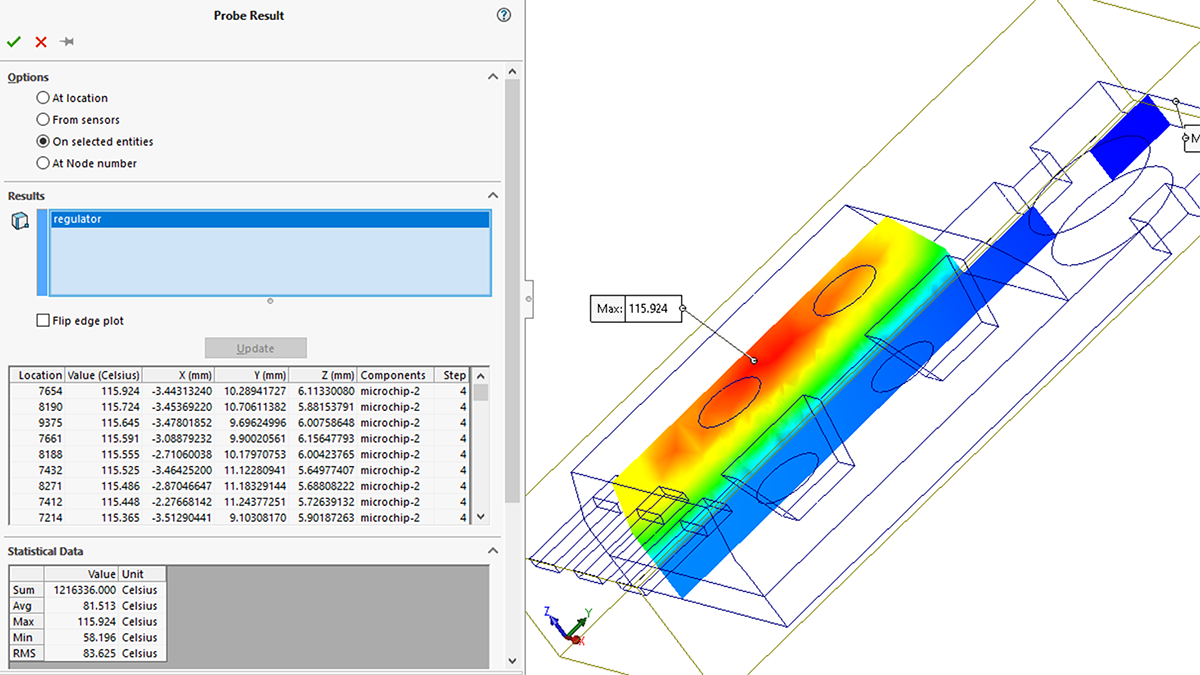
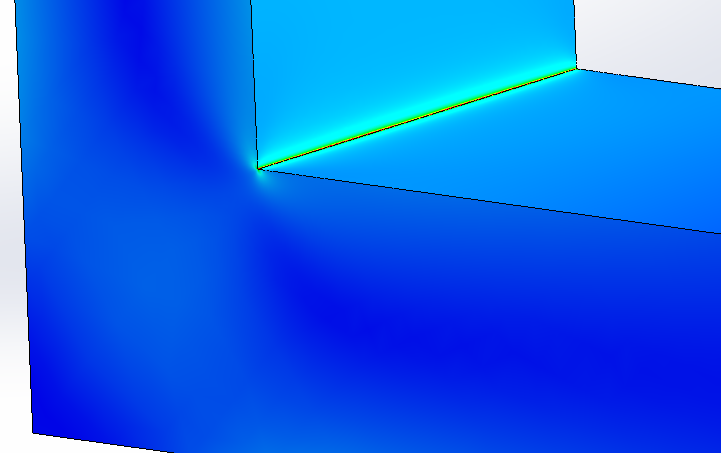
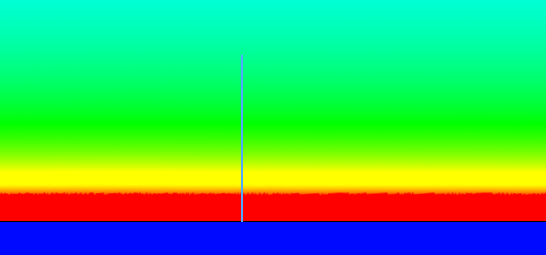
As the mesh got more refined the singularity’s effect and size shrank. In Figure 19 I set the color scale to show red for the yield stress and as you can see in the image and data the effect of the singularity is very small. I zoomed in a lot for Figure 20 and the blue line is the entity separating sensor 1 and 2 and has a length of 0.22mm. So, we can see that the singularity is not affecting much further than about a third of the line.
|
|
|
Final Conclusion (TLDR;)
For those of you who scrolled to the end while only looking at the pictures here is my final statement for the results. The more you refine the mesh around a singularity the less of your model it will affect. The closest location I tried to get a mesh independent value for was 0.22 mm (0.0087 in) away from the singularity and I got converging results that were below yield and of a comparable value to a similar model without a singularity. So if your simulation has a singularity that you cannot model away this procedure can help you locate where your values are no longer being affected by the singularity.
For more information, check out our YouTube channel, get a SOLIDWORKS Simulation quote or contact us at Hawk Ridge Systems today. Thanks for reading!